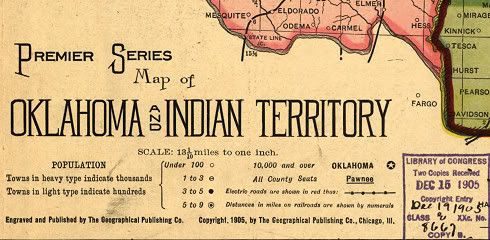
Every now and then, one runs across something really special on the internet, something you’ve not seen before and just gotta have. When browsing through the Library of Congress stuff this past weekend, I ran across just such a thing, a marvelous high resolution map of Oklahoma in 1905, following a census which had just occurred, published by the Geographical Publishing Company of Chicago, Illinois.
State Map Oklahoma County Vicinity Tulsa Vicinity
Black Towns State Quadrants Gazetter
ABOUT THIS MAP. The map was received by the Library of Congress in December 1905 and consists of two parts: (a) the map; and (b) the gazetter. City and town population is stated to be taken from a 1905 census however it is evident that county populations are from the 1900 census, as pointed out by Charles G. Hill, below.
For comparison with this map, see the 1892 Rand, McNally & Company high resolution map.
For a 2,048 pixel wide version of the map & gazetter below, click here
For a 1,024 pixel wide version of the map & gazetter below, click here
If you want to go the Library of Congress website and download your own copy, aside from what is presented here, feel free — just click here. There, at the bottom of that page, you’ll see that the very high resolution map can be downloaded, but you’ll also see that the download is in JPG2000 format (JP2) — and not a lot of us have graphic software that can read that format, particularly in its most recent iteration. Also, the JP2 file is HUGE — 16.6 MB, measuring 8,624 x 13,422 pixels — whoa!
Before locating this file, I didn’t have graphic software that could read late versions of JP2 files, but I found some free software that would and would also convert it to more traditional graphic formats such as TIFF, etc. It works great and is totally free, and I recommend it. The software is IrfanView and can be downloaded here. After downloading and installing it, I learned that separate “plug-ins” were also required to read the LOC map file — so, to save you such steps, after downloading and installing IrfanView, go here to download and install the plug-ins that are needed to read the LOC JP2 file. After doing both of those steps, after downloading the humongous LOC file, you will be able to view and/or convert the Library of Congress JP2 file, which has apparently become the “default” LOC graphic format for its more recent postings.
Either do the above, or read on here and copy and save what you want to your own computer of the product of my work with this file today. It’s all gratis.
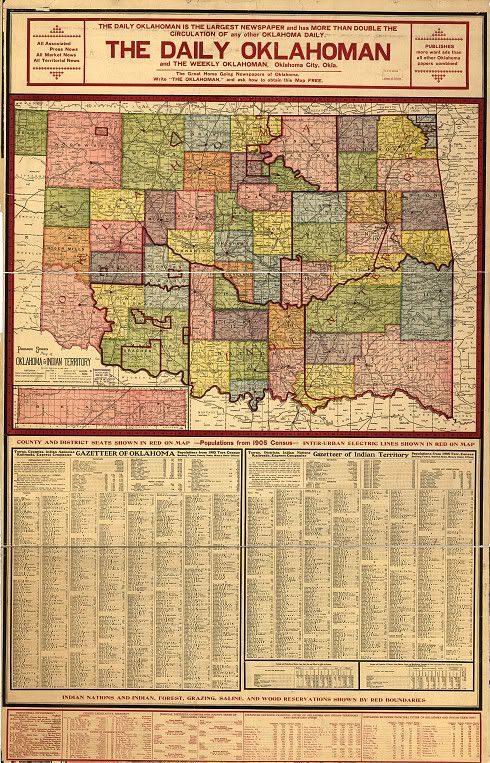
Despite the prominent Daily Oklahoman item at the top of this map, it is not the product of the Daily Oklahoman — in this instance, the Oklahoman was buying advertising space in someone else’s product and did not produce the map. Instead, the map was made in 1905 by the Geographical Publishing Company, located in Chicago. About such maps, a page at the LOC says this:
Copyright and Restrictions
Most maps in the Map Collections materials were either published prior to 1922, produced by the United States government, or both (see catalogue records that accompany each map for information regarding date of publication and source). A few have permission from the copyright holders as noted in the descriptive record. The Library of Congress is providing access to these materials for educational and research purposes and is not aware of any U.S. copyright protection (see Title 17 of the United States Code) or any other restrictions in the Map Collection materials.
Note that the written permission of the copyright owners and/or other rights holders (such as publicity and/or privacy rights) is required for distribution, reproduction, or other use of protected items beyond that allowed by fair use or other statutory exemptions. Responsibility for making an independent legal assessment of an item and securing any necessary permissions ultimately rests with persons desiring to use the item.
Gladly, this map was produced in 1905 and appears to have no current copyright restrictions and so, within the above definition, it appears to be freely usable by anyone that wants — aside from selling the map as one’s own, which I’m not doing. What I do in my blog is always free for the taking.
Now, let’s get to the map. This article doesn’t have much further text and the graphic images below are presented either as research tools for those so inclined or for those who “just like maps.” You may have noticed that a horizontal white line or seam exists in the original LOC map — I don’t know if that was because it was “torn” or because it had been broken into segments. In the “map only” images below, I’ve edited the original graphic file to eliminate, as much as possible, the “white line” in the original map, taking care not to change the map itself.
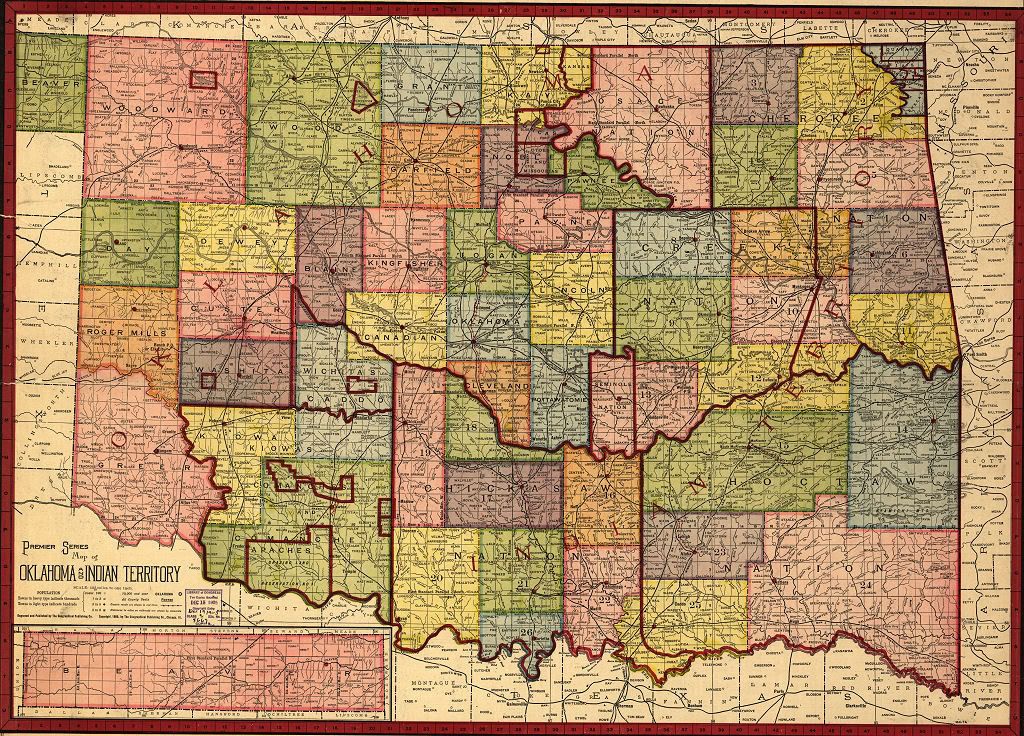
THE MAP. The following images present sections of the LOC map, first for the entire state, then central Oklahoma, the Tulsa vicinity, Black Towns, and then map sections for each quadrant of the state. Gazetter elements follow the maps, showing populations and locations within the map.
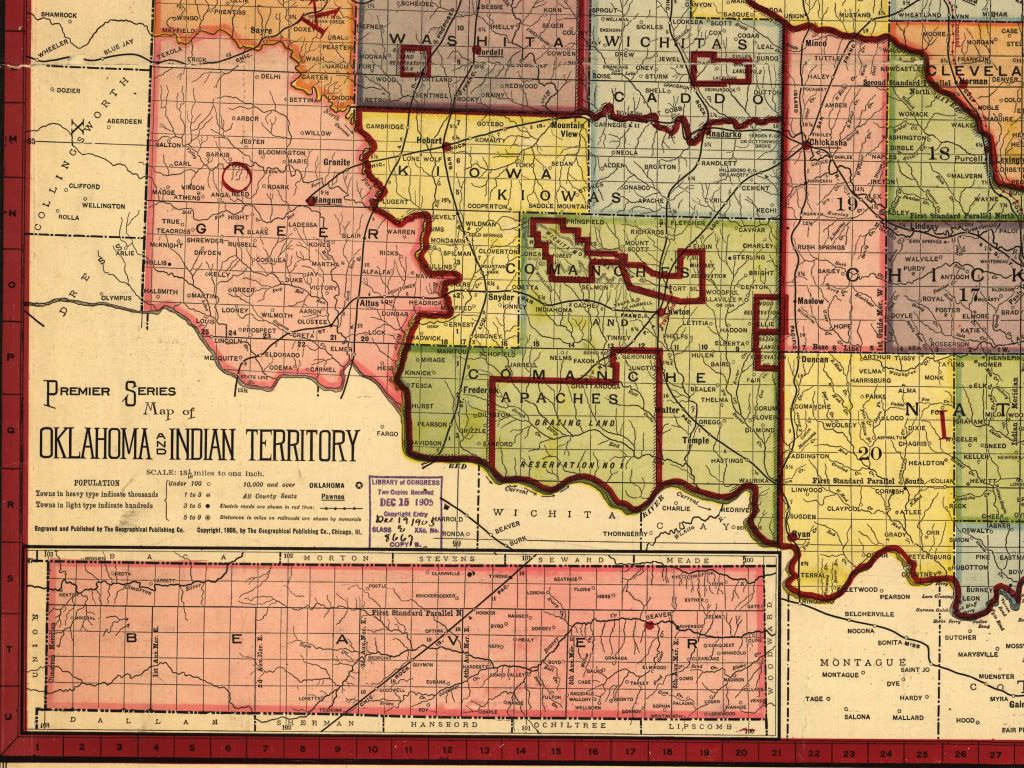
THE STATE MAP. After the “state” map below, each “quadrant” state map is also show below in more particular detail. In all following maps, the “tear line” has been edited out to show better maps, even though though the original was not that way.
Click the map for a 1,024 px wide view of the map, or
For a 3,000 px wide view of the map below, click here
For a 4,000 px wide view of the map below, click here
For a huge 8,367 px wide view of the map below, click here
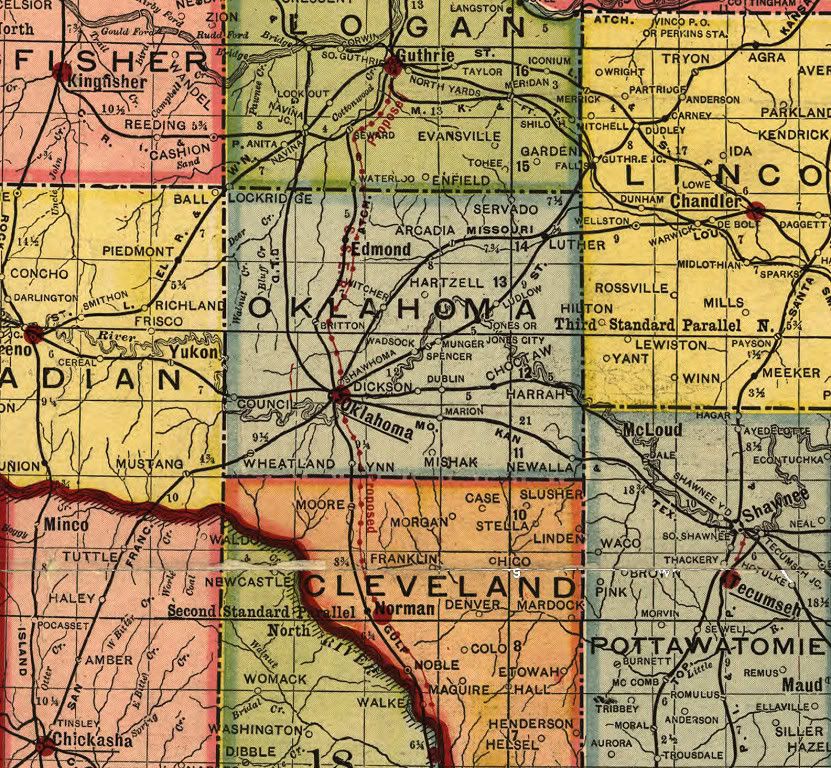
OKLAHOMA COUNTY & ENVIRONS. While all parts of the state map are presented below, Doug Dawgz focal interest is, of course, Oklahoma City. You will see no “road maps” in this 1905 map — they didn’t exist in 1905, at least not officially. But railroads did, big time — they were the “roads” of the day.
Click the map for a larger view
Oklahoma County Only
Click Map for Larger View
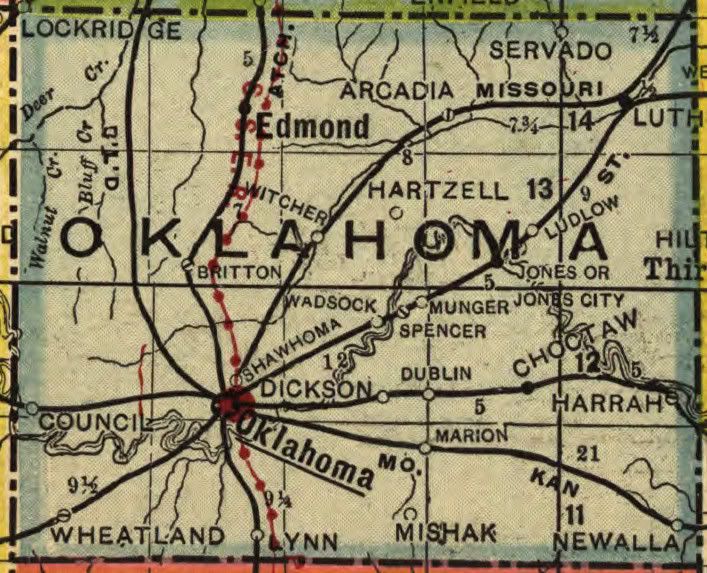
Will you look at all of those rail lines converging on Oklahoma City in 1905! I’m going to ask my friend and railroad aficionado Dean Schirf to identify what all of them are after this original article is written! Notice the “red” dotted north-south line running through Oklahoma City — that shows the location of the then proposed Oklahoma Railway Company interurban electric train line, proposed to run from Guthrie all the way down to Davis and over to Sulphur! While such a line was established, it didn’t go south of Norman, but it did extend from Oklahoma City to El Reno in a part of the interurban not shown on the map. Look closely and you’ll also see a short actual interurban line between Shawnee and Tecumseh, the latter then being the county seat.
A problem exists in the Gazetter which I was initially at a loss to explain. The Gazetter shows Oklahoma County’s population as 25,915 but shows Oklahoma (City) to be 31,700. Charles G. Hill’s Dustbury to the rescue! In a comment there, he said,
The problem with the Gazetteer is actually pretty simple: the county figures are from the 1900 Census — I verified the 25,915 figure from Census data — but the individual cities and towns are given 1905 estimates. (Population of OKC in 1900 was 10,037.) In 1910 Oklahoma County would have 85,232 people, which should give you an idea of how fast things were growing in those days.
So, apparently comparing county v. city/town populations is like comparing apples and oranges.
Notice that quite a number of towns most of us have never heard of are present … at least, I hadn’t. In Oklahoma County, beginning in the northwest corner and going clockwise (more or less), notice: Lockridge, Servado, Hartzell, Ludlow, Wadsock, Munger, Dublin, Shawhoma, Dickson, Marion, Mishak, Lynn, and Wheatland. What happened to those communities?
Master-blogger Charles G. Hill provides at least some of the answers to the above — see his nicely done Dustbury blog article to learn more about “Servado” and the rest! There, he says,
Obviously I don’t know all these, but I’ll take a stab at a couple of them, armed with some genealogical data, some 1900 Census numbers, and a little bit of experience. (I used to live near what used to be Dickson.) The grid on the Oklahoma County map shows township lines; each township is six miles square. The north-south lines, west to east, are present-day May Avenue, Bryant Avenue, Post Road and Indian Meridian; the west-east lines, north to south, are 164th, Wilshire and Reno.
Wheatland still exists, sort of: it has a post office (boxes only: 73097) and a Main Street, which is the extension of Newcastle Road southbound right before it runs into Council Road. Most of the telephones between Mustang and Will Rogers World Airport were considered by AT&T to be in the Wheatland zone (prefix: SHadyside 5).
Dickson was formerly Chaddick, and was located along the Rock Island line east of town. All that remains of the name, I think, is the Dickson Baptist Church at 2000 N. Spencer Road, within current Midwest City limits. (1900 population: 23.)
The Munger townsite, then four years old, was renamed Spencer in 1903, perhaps after the railroad (Santa Fe) came through, but apparently both sidings were retained. (This probably also explains Wadsock, just to the southwest.) These are all in the Crutcho township. (1900 population for Munger: 18.)
Hartzell was the name of the township just north of Crutcho; there was a post office there until 1906. It was named for its postmaster, as was Mishak, 13 miles to its south. There exists a Mishak Cemetery, between Douglas and Post along SE 59th; Mishak Baptist Church is nearby. (1900 population: Hartzell, 22; Mishak, 14.)
Lynn is almost, but not quite, in the right place for present-day Valley Brook. It’s not listed in the Census.
Servado (1900 population: 42) lost its post office after 1905, and the mail went to Luther instead; this area appears to be unincorporated, and Luther has extended a half-mile-wide finger of its city limits as far west as Henney Road, presumably to prevent Oklahoma City from annexing it.
All the references I’ve seen to Shawhoma (not many) mention a railyard, which suggests that this might have been the stretch along the Santa Fe between 23rd and 36th. It never had a post office of its own, so far as I can tell.
Lockridge was technically in Logan County; it survived as a post office until 1928.
If I come up with anything else, I’ll tack it onto the bottom.
Good job, Chaz!
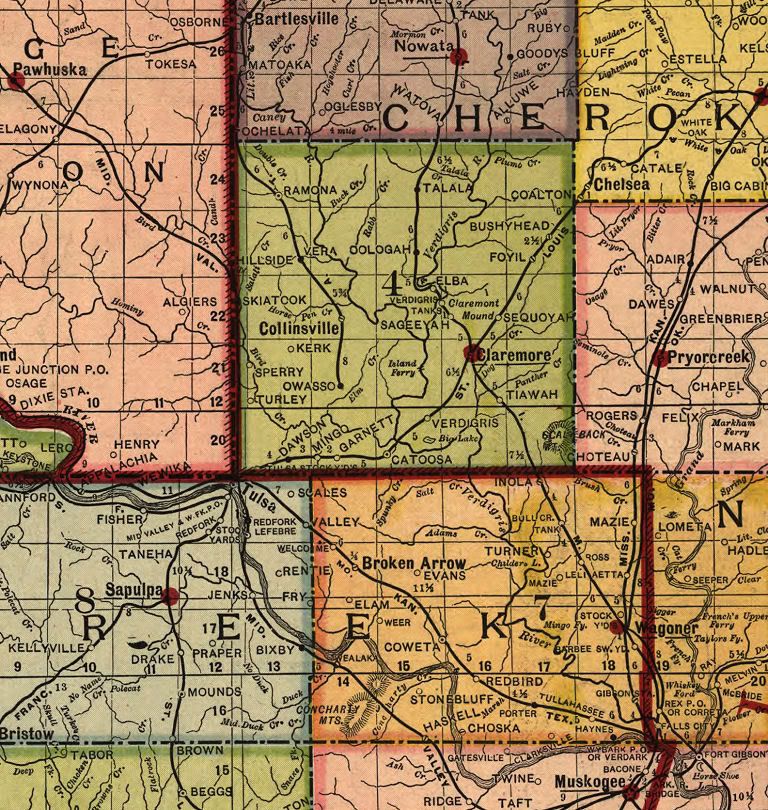
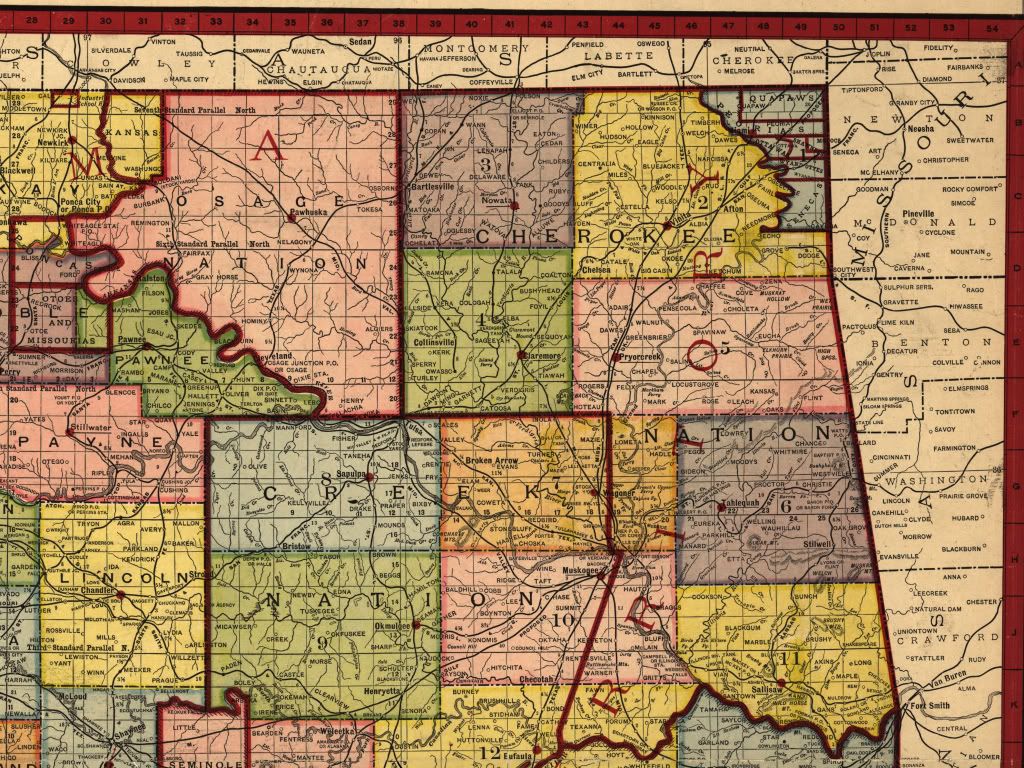
TULSA VICINITY. Unlike western Oklahoma with its six land openings between 1889 and 1901 in which Indian lands were opened for settlement and which resulted in a mass influx of mainly white but some black settlers — (1) Land Run of 1889 on April 22 (Logan, Kingfisher, Oklahoma, Payne, and Cleveland counties); (2) Land Run of 1891 on September 22 (Lincoln and Pottawatomie counties); (3) 1892 Land Run on April 18 (Blaine, Dewey, Day – obsolete county combined with Ellis, Roger Mills, Custer, and Washita); (4) Land Run of 1893, also known as the Cherokee Strip Land Run of 1893, on September 16 (Garfield, Grant, Kay, Noble, Pawnee, Woods and Woodward counties); (5) Kickapoo Land Run of 1895, on May 3 (parts of Lincoln, Oklahoma, and Pottawatomie counties); and (6) the Land Lottery in 1901, August 1 (Comanche, Cotton, Tillman, Caddo, and Kiowa counties) — eastern Oklahoma had no such experience. So, there were no explosive “born grown” cities or towns in Indian Territory, nor were the cities there as largely populated at this point in time, compared to Oklahoma Territory.
The Tulsa area was relatively small in population, except for Muskogee. The populations shown for the principal cities in the Tulsa vicinity were as follows: Bartlesville, 3,400; Nowata, 1,200; Collinsville, 1,600; Claremore, 2,150; Pawhuska, 2,500; Pryorcreek (Pryor), 875; Broken Arrow, 950; Wagoner, 2,500; Sapulpa, 2,600; Tulsa, 5,680; and Tulsa Stock Yards, 5,000. Note that Pawhuska was part of Oklahoma Territory, not Indian Territory. The largest city in the area was Muskogee with 14,200.
Click the Map for a Larger View or
click here for a higher resolution view
PREDOMINANTLY BLACK TOWNS. Many such towns existed in Indian Territory before that territory was divided into two territories. Later, during the various land openings in Oklahoma Territory several more predominantly African American towns came into existence, some of which survive to this day. The 1905 map and gazetter identifies the location and population of many but not all of these towns. In identifying the towns, I have relied on two sources: (1) The Oklahoma Historical Society’s Encyclopedia of Oklahoma History & Culture in its article All-Black Towns, and (2) the African-Native American History & Genealogy Web Pages, more particularly its African Towns and Settlements of Indian and Oklahoma Territories page. While I’m not able to vouch for the accuracy of either, I have no cause to believe that either contains glaring errors – even though the OHS article does contain at least a few obvious mistakes, such as saying that Bailey and Boley were located in Oklahoma and not Indian Territory, the latter being correct. This New York Times article claims that 50 such towns existed, but does not name them or provide any corroborating data and the claim appears to be an exaggeration. Also, see this article by Hannibal Johnson. This Tulsa County Library web page contains some additional information and images.
The following edited version of the 1905 map shows the predominantly black towns that I’ve been able to identify. If I’ve made mistakes or omissions, comments would be appreciated and welcome.
Click here for a 3000 x 2155 pixel view
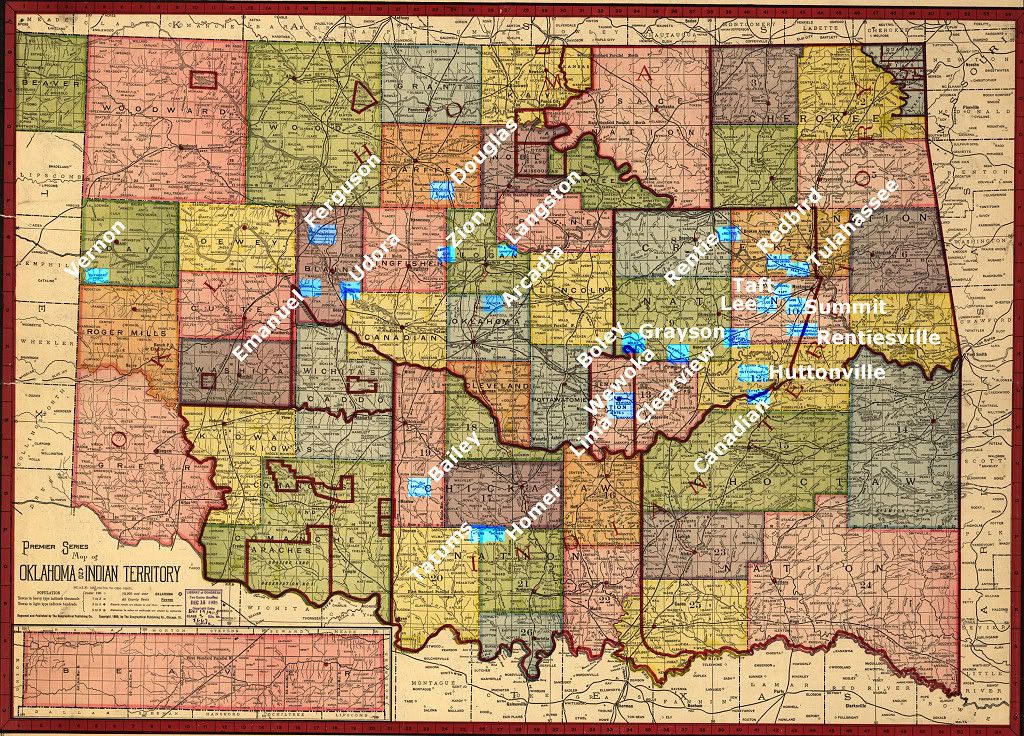
The following table identifies the towns contained in both the OHS and Genealogy Web Page sources. An ‡ indicates the OHS source; a pair of ** indicates the other; and a pair of ?? means I’m unsure of the location being the same as I’ve shown in the map – the only one is for Canadian Colored, not necessarily shown in the map, which merely shows “Canadian.” However, the location of Canadian Colored is very near Eufaula, as shown in the map. All identified towns are not in both resources. The table indicates whether a town is shown in the 1905 map and/or 1905 gazetter, and, if stated in the gazetter, its population.
| Town | Terr | County or District or General Location | In Map | In Gaz | Population |
| Arcadia ** | OT | Oklahoma | Yes | Yes | 125 |
| Arkansas Colored ‡ ** | OT | Oklahoma | Yes | Yes | 125 |
| Bailey ‡ ** | IT | 19 | Yes | Yes | 12 |
| Boley ‡ ** | IT | 19 | Yes | Yes | 45 |
| Bookertee ‡ ** | IT | NE of Weleetka | No | No | |
| Canadian Colored ‡ ** ?? | IT | 12 | Yes | Yes | 522 |
| Chase ** | IT | SE of Muskogee | No | No | |
| Cimarron City ‡ | OT | Logan | No | No | |
| Clearview ‡ | IT | 9 | Yes | Yes | 11 |
| Douglas ‡ | OT | Garfield | Yes | Yes | 100 |
| Emanuel ‡ | OT | Blaine | Yes | Yes | 10 |
| Ferguson ** | OT | Blaine | Yes | Yes | 100 |
| Grayson ‡ | IT | 9 | Yes | Yes | 15 |
| Homer ‡ ** | IT | 21 | Yes | Yes | 75 |
| Huttonville ‡ | IT | 12 | Yes | Yes | 7 |
| Langston ‡ ** | OT | Logan | Yes | Yes | 300 |
| Lee ‡ | IT | 10 | Yes | Yes | 20 |
| Lima ‡ | IT | 13 | Yes | Yes | 33 |
| Lincoln City ‡ ** | OT | Kingfisher | Yes | No | |
| Mabelle ‡ | IT | Could not locate | No | No | |
| Marshall Town ‡ ** | IT | NE near Verdigris River | No | No | |
| North Fork Town ‡ ** | IT | Near Eufaula | No | No | |
| Old Vinita ** | IT | 2 | No | No | |
| Redbird ‡ | IT | 7 | Yes | Yes | 8 |
| Rentie ‡ | IT | 8 | Yes | Yes | 7 |
| Rentiesville ‡ | IT | 10 | Yes | Yes | 7 |
| Sanders ‡ | IT | Could not locate | No | No | |
| Summit ‡ | IT | 10 | Yes | Yes | 75 |
| Taft ‡ | IT | 10 | Yes | Yes | 8 |
| Tatums ‡ | IT | 20 | Yes | Yes | 25 |
| Tullahassee ‡ | IT | 7 | Yes | Yes | 12 |
| Udora ‡ | OT | Blaine | Yes | Yes | 7 |
| Vernon ‡ | OT | Day | Yes | Yes | Not stated |
| Wewoka ** | IT | 13 | Yes | Yes | 600 |
| Wybark ** | IT | N of Muskogee | No | No | |
| Zion ‡ | OT | Kingfisher | Yes | Yes | 8 |
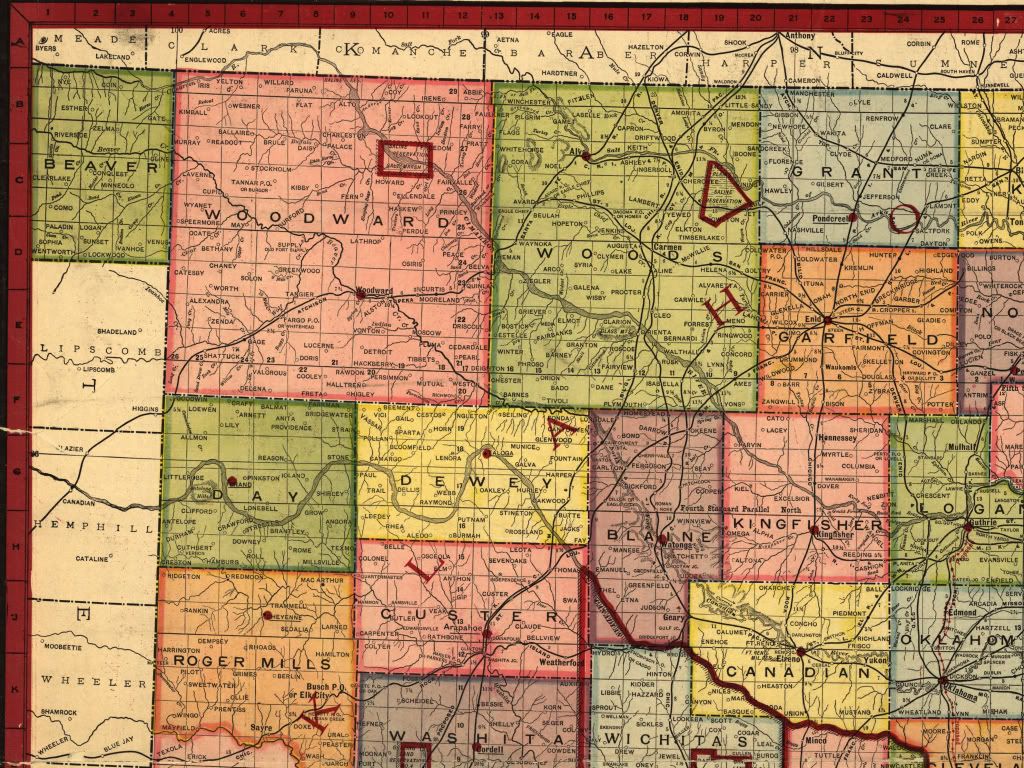
STATE QUADRANT MAPS. The following images “quarter” the LOC map into Northwest, Southwest (including the Panhandle), Northeast, and Southeast quadrants. In addition to clicking on a map for a somewhat larger (1024 pixel wide) view, higher resolution version links are also presented.
Click the map for a 1,024 px wide view or
For a 2,400 px wide view, click here.
Southwest & Panhandle
Click the map for a 1,024 px wide view or
For a 2,400 px wide view, click here
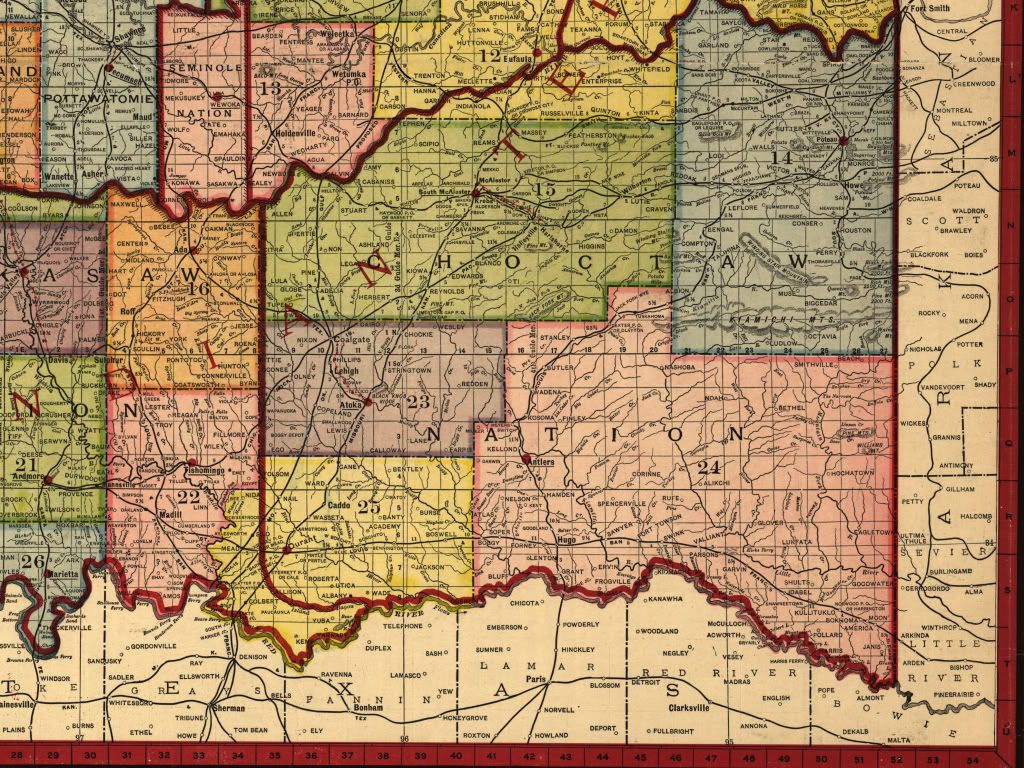
Southeast
Click the map for a 1,024 px wide view or
For a 2,400 px wide view, click here
Northeast
Click the map for a 1,024 px wide view or
For a 2,400 px wide view, click here
THE GAZETTER. As noted earlier, an obvious discrepancy exists when comparing county v. city or town population data in the Gazetter (Oklahoma County v. Oklahoma [City] population). As already said, Charles G. Hill of Dustbury fame provided the reconciling information in a comment to his own article — that “county” data is from the 1900 census but that city and town data is from the 1905 census. So, take care when comparing county and city/town populations. The Gazetter shows locations and 1905 populations for those cities and towns reflected in the map. The map presents that information by the existing federal territories, Oklahoma and Indian Territory. Railroads within each territory, Native American tribal and other information are also shown.
OKLAHOMA TERRITORY. In these days, Oklahoma County or City (actually, “City” was not part of the city’s name in 1905) may not have been the big kid on the block, although, as mentioned above, the Gazetter shows Oklahoma (City’s) population as of 1905 was 31,700 but shows Oklahoma County’s population as 25,915, but Mr. Hill informs that the county population was based on the 1900 census. It was a surprise to see that the county shown as having the largest population was Woods County (which would be in 1900, according to Mr. Hill)!
| Counties over 20,000 | 1900 Population – see above | ||
| Woods County (Alva) | 34,975 | ||
| Lincoln County (Chandler) | 27,007 | ||
| Pottawatomie County (Tecumseh) | 26,412 | ||
| Logan County (Guthrie) | 26,563 | ||
| Oklahoma County (Oklahoma) | 25,915 | ||
| Kay County (Newkirk) | 22,530 | ||
| Garfield County (Enid) | 22,076 | ||
| Payne County (Stillwater) | 20,909 |
Railroad companies serving the territory are shown to be: Atchison, Topeka & Santa Fe; Chicago, Rock Island & Pacific; Denver, Enid & Gulf; Fort Smith & Western; Kansas City, Mexico & Orient; Missouri, Kansas & Western; and St. Louis & San Francisco.

INDIAN TERRITORY. Indian Territory was not then divided into “counties” — instead, numbered “districts” are shown, 26 of them. District populations are not shown but city and town populations were. Strictly speaking, only one, Muskogee, was above 10,000 at 14,200. Tulsa was 5,680, though nearby “Tulsa Stock Yards” (between Tulsa and Sapulpa) had 5,000. McAlester had 2,500, but nearby South McAlester added another 7,000. Tribal populations were quite large, those over 40,000 being shown below:
| Indian Nations Over 40,000 | 1905 Population | ||
| Chickasaw (Tishomingo) | 139,260 | ||
| Cherokee (Tahlequah) | 101,754 | ||
| Choctaw (Tuskahoma) | 99,781 | ||
| Creek (Okmulgee) | 40,674 |
After the Creek Nation, the drop off was pretty steep — next was the Seminole Nation at 3,786. The Gazetter does not make clear whether the tribal populations were from the 1905 census estimates or were based on the 1900 census.
An abundance of railroad companies was present: Arkansas & Western; Atchison, Topeka & Santa Fe; Chicago, Rock Island & Pacific; Fort Smith, Poteau & Western; Kansas City Southern; Kingston & Choctaw Valley; Midland Valley; Missouri, Kansas & Texas; Misouri, Oklahoma & Gulf; Missouri & Louisiana; Poteau Valley; St. Louis, Iron Mountain & Southern; and St. Louis & San Francisco.

That’s it! Enjoy the map!