
For Part 2, Oklahoma City’s Area Growth, click here.
POPULATION. The focus of this article is on population — the number of butts in the seats, so to speak. A researcher cannot obtain a city’s specific population without obtaining data which relates to the entire state since the primary data source is the US Census Bureau. I want to know, authoritatively and from first-hand sources, what Oklahoma City’s population has been at each point of official measurement, or even unofficial measurements if those might exist from reliable sources from time to time.
 But, where are they to be found? All “first-hand” population data comes from the US Census Bureau. If you’ve ever attempted to navigate through the on-line records of the US Census Bureau, you may have experienced some of the same frustration that I have, from time to time. Whether I’m just not very smart about navigation there or whether the site is not particularly intuitive, or both, I don’t know. Regardless, coming up with quick “on the fly” information at the Bureau’s website has not been easy for me. That fact lead me to conclude, “Let’s spend some of Doug Dawgz valuable time, find the sources there, and then make a database that can be used over and over, whenever the need or desire exists. That’s what this article provides, for you and for me.
Using the PDF Population Files. Except for the 1907 census, all of the PDF files linked in this article have as their source other PDF files located at the Census Bureau’s website. Not being able to locate Oklahoma’s 1907 special census at the Census Bureau’s collection, I did find it here at the Oklahoma Department of Libraries website.
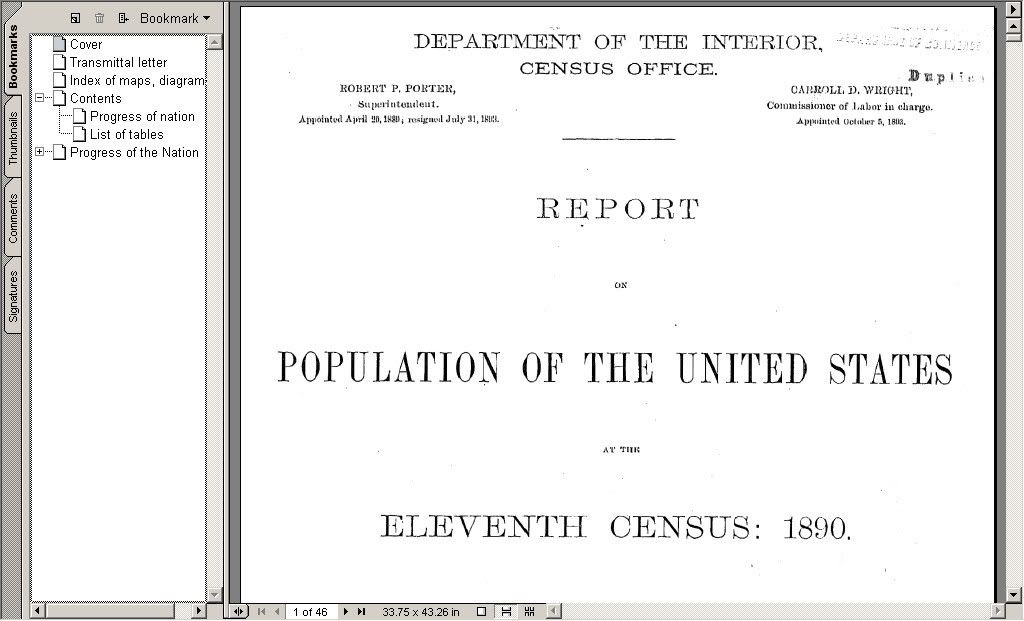
For the files located at the US Census Bureau, they were (1) downloaded and (2) the Oklahoma references were identified. Then, (3) the graphic files were extracted, cropped and resized as needed, and some non-data blemishes were deleted, and then resaved. As an example, some of the original pages looked like that shown below (except for the curl which I just added for fun here:

Such a page was rotated, cropped to eliminate scanning blemishes, and new “clean” border space added.
The last step was to (4) create entirely new PDF files for the Oklahoma-based data, including making “bookmarks” in each PDF file. Each of the PDF files so made will open in “bookmark” view, looking something like the example below:
Zooming in for a closer look at the bookmarks

With the bookmark view open, click on a bookmark to move to that page’s location. The bookmark feature makes the PDF files more user-friendly.
Notice the “+” sign in the above example. That means that a collapsible bookmark “tree” is present. When present, click in a “+” to expand the tree; click on a “-” to close it.
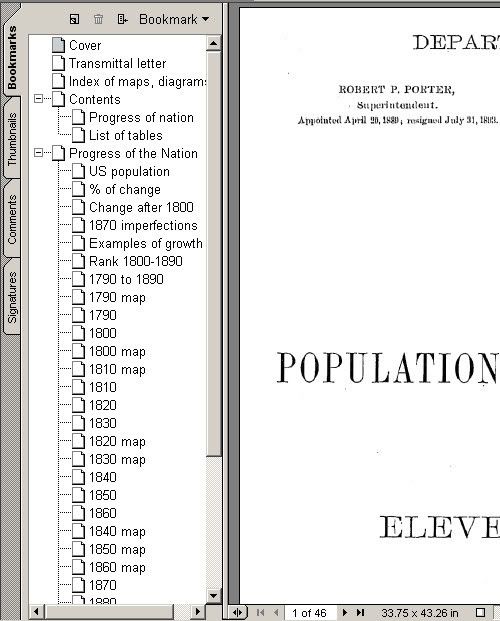
You may also prefer not to see the bookmarks … just click on the bookmark “tab” at the right side to open or close the bookmarks in the viewing area.
Opening or saving the PDF files. To open any file, left-click on any link as you would normally do and the file will open. But, if you know that you want to save a file to your computer, the quickest way to do that is to right-click on a link and, from the pop-up menu, save the targeted file to somewhere on your computer’s hard disk. The menu will vary depending on the web browser you are using. Firefox and Internet Explorer examples are shown below:


OKLAHOMA POPULATION DETAIL — THE POINT OF BEGINNING. While the eventual article will focus on Oklahoma City, this part focuses on the entire state’s population as a point of beginning. It is principally intended to provide reliable research data for me as well as anyone else interested in knowing the history of Oklahoma population. In the past, I’ve recited various numbers of Oklahoma City’s population in articles written here, relying upon what other writers have said. Sometimes, I’ve been frustrated in not quickly finding either small or large points of population history from what others have written in their books and articles or from the Census Bureau itself.
So, I decided to get my own first-hand information from the US Census Bureau or other authoritative sources that I could locate and then make a database for later use. While I was at it, I also decided that it would be good to make that database readily available, in one place, for anyone else that might want to use it. So, this section is really not about Oklahoma City, it is about Oklahoma.
I’ve located US Census files from 1890 and beyond, but where to stop for purposes of this article? For my purposes, that would probably be 1950 or so … but I carried it forward two decades to 1970’s official census to give a little elbow room should I later want that information, as well.
Below, the links below provide, at a minimum, the most Oklahoma-relevant portions of the census data for the periods identified below. Additional description is given after the links. All links are to PDF files which contain the raw data. “Parts” identified are not part of the US Census Bureau’s nomenclature, they are mine.
1890 Census. I’ve included in the extracts below all parts which specifically or generally relate to Oklahoma. The 1890 census file is Oklahoma-complete, omitting nothing Oklahoma oriented.
- 1890 census, part 1 File size: 39 MB description
- 1890 census, part 2 File size: 4.7 MB  description
- 1890 census, part 3 File size: 11 MB description
- 1890 census, part 4 File size: 6.5 MB description
- 1890 census, Appendix File size: 2.3 MB description
1900 Census. I’ve broken down 1900 census selections into two parts, and I’ve not included as much detail as I did with the 1890 census.
- 1900 census, part 1 File size: 4.8 MB description
- 1900 census, part 2 File size: 1.8 MB description
1907 Census. The complete statehood file is included.
- 1907 census File size: 7.6 MB description
1910 Census. I’ve broken down 1910 census selections into two parts, and I’ve not included as much detail as I did with the 1890 census.
- 1910 census, part 1 File size: 20 MB description
- 1910 census, part 2 File size: 21 MB description
1920 Census. 1920’s census is broken into four parts. Parts 3 and 4 are not as extensively bookmarked as parts 1 and 2.
- 1920 census, part 1 File size: 12 MB description
- 1920 census, part 2 File size: 11 MB description
- 1920 census, part 3 File size: 13 MB description
- 1920 census, part 4 File size: 8.5 MB description
1930 Census. In these two files, I’ve avoided the hyper-detailed parts of the census report which analyze sex, race, birth place, agriculture, mines, etc., although summary information is sometimes available in what I’ve included. My focus is on numbers of people and the two files below contain that information.
- 1930 census File size: 15 MB description
- 1930 census, metropolitan File size: 9.15 MB description
1940 Census. The same data presented for the 1930 census is included in this single file.
- 1940 census File size: 13 MB description
1950 Census. My selections for the 1950 census are broken into three parts and focus on population and not much else.
- 1950 census, part 1 File size: 29.7 MB description
- 1950 census, part 2 File size: 27.3 MB description
- 1950 census, part 3 File size: 17 MB description
1960 Census. My selections for the 1960 census are the same as those used for 1950 — population numbers.
- 1960 census, part 1 File size: 21.6 MB description
- 1960 census, part 2 File size: 23.5 MB description
- 1960 census, part 3 File size: 5.59 MB description
1970 Census. At present, only the Oklahoma-only population statistics are presented here.
- 1970 census File size: 15.7 MB description
Brief File Descriptions. Very brief general statements about the particular PDF files are presented below. More detail is included in the files themselves. To move to the area to open or download particular files, click the link which begins each description.
1890 Part 1 is largely a 46 page history of the United States from 1790 though 1890, with a few bits of Oklahoma/Indian Territory information thrown in, and it contains some great United States maps, such as the one shown below.

Zooming in …

Although it contains occasional references to Indian or Oklahoma territories, I’ve mainly included it because of its comprehensive overview of United States history which, in our context, culminated in the 1889 and other Land Runs which would shortly follow.
1890 Part 2 contains 10 pages of standard population information that most are probably looking for — state by state comparative information and such county and town data as was contained in this census, which is not much.
1890 Part 3 contains 18 pages of detail by race, gender, and place of birth.
1890 Part 4 contains 75 pages of fairly esoteric detail: state or territory of birth, county of birth, foreign parentage, those of school, militia and voting age, conjugal (marital) condition, and dwellings and families.
1890 Appendix relates to Native American population, mostly Alaskan. Only the 6 pages which relate to Indian Territory are included.
1900 Part 1 is a 16 page extract of the standard population information that most probably want — county, city/town population, for both Oklahoma and Indian Territories.
1900 Part 2 includes 24 pages of detail about gender, race, and place of birth.
1907 includes the complete 43 page census file, directed to be taken upon Oklahoma’s admission to statehood. It is often referred to as US Census “Special Bulletin 89.” Unlike all other PDF files in this collection, the PDF pages are not “images” but are “text” and the blemishes, rotation, etc., in the original file cannot be corrected. The only items added in this file compared to the original are the navigation bookmarks.
1910 Part 1 is a 26 page extract of the standard population information that most probably want — county, city/town population, for both Oklahoma and Indian Territories.
1910 Part 2 contains 26 pages of detail concerning population composition (race, sex, place of birth, age, school attendance, illiteracy, and marital condition). The file contains detail for Oklahoma City’s Wards and excellent county and city origin descriptions.
1920 Part 1 is a 26 page extract of the standard population information that most probably want — county, city/town population, for both Oklahoma and Indian Territories.
1920 Part 2 contains 30 pages of detail concerning population composition (race, sex, place of birth, age, school attendance, illiteracy, and marital condition). Detail about working women and home ownership is also included.
1920 Part 3 contains 46 pages relating to agriculture and irrigation. It is not presently extensively bookmarked.
1920 Part 4 contains 29 pages relating to manufacturers, mines, and quarries. it is not presently extensively bookmarked.
1930 contains 26 pages of Oklahoma population detail by city and county. I’ve not included data which is descriptive of gender, race, etc. If you want that, read it for yourself in this PDF file at the census website.
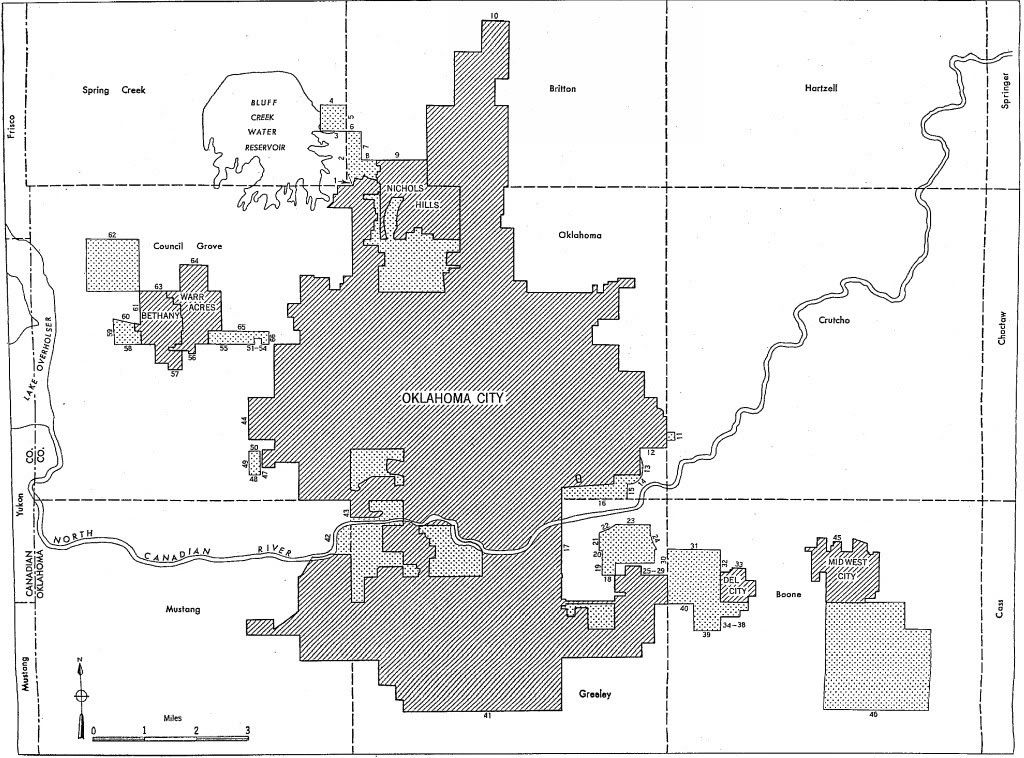
1930 Metropolitan contains 17 pages of data relating to Oklahoma’s two metropolitan areas, Oklahoma City and Tulsa, including several general pages which describe how such areas were defined and pages which rank the then existing metropolitan areas in the country. A pair of maps show the Oklahoma areas, cropped versions appearing below:
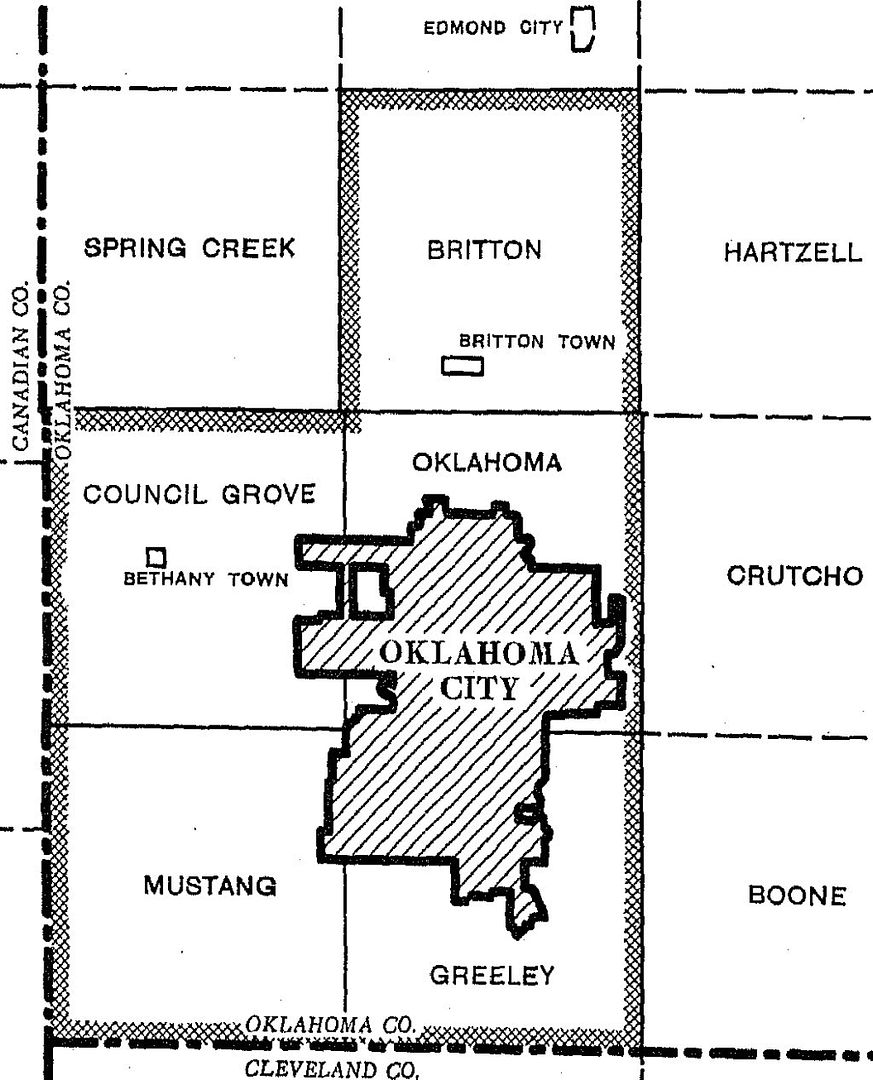
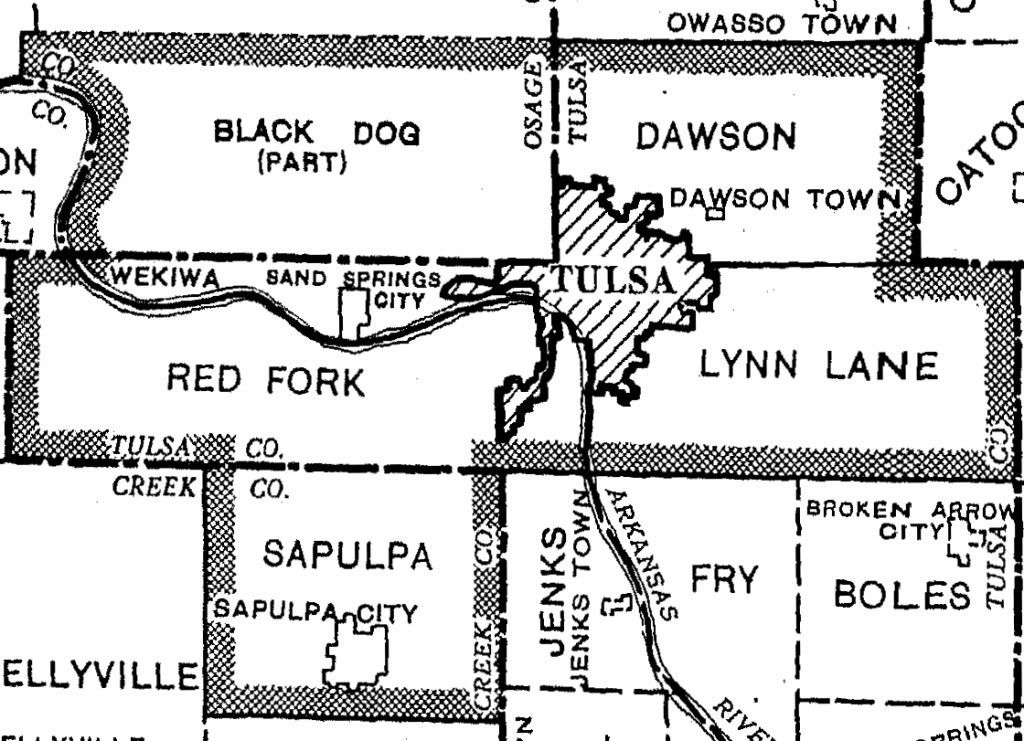
Interestingly, notice that, at the time, the spatial area of the Tulsa metro (391.4 square miles) was considerably larger than Oklahoma City’s much more compact area (181.78 square miles) all of which was located well inside Oklahoma County. That fact shows up in the metro population numbers … note that, in 1920, Tulsa’s metro population was slightly larger that Oklahoma City’s.
Metropolitan Area 1920 1930 Oklahoma City 91,295 185,389 Non-Okc Metro 9,478 16,774 Okc Metro Total 100,773 202,163 Tulsa 72,919 141,258 Non-Tulsa Metro 31,460 41,949 Tulsa Metro Total 104,379 183,207
1940 contains the same type of data that 1931’s files do, except that the data is all in a 20-page single file which includes metropolitan area information. If you want other types of census information, you can go to this Census Bureau page and find what you want.
The metropolitan area maps shown show the boundaries for the Oklahoma City and Tulsa metropolitan areas did not change from the 1930 census, even though the corporate municipal boundaries are slightly larger than in 1930, as shown in the maps below:


The statistics presented show the Tulsa metro to be relatively unchanged from the 1930 numbers, but that it did grow slightly in the non-Tulsa parts of the metro; Oklahoma City’s growth was a bit more robust, largely occurring in the city itself, but the decade’s growth was nothing to write home about.
Metropolitan Area 1930 1940 Oklahoma City 185,389 204,424 Non-Okc Metro 16,774 16,805 Okc Metro Total 202,163 221,229 Tulsa 141,258 142,157 Non-Tulsa Metro 41,949 46,405 Tulsa Metro Total 183,207 188,562
1950 Part 1 contains 37 pages of general census information. The main reason for its inclusion is its discussion of “Standard Metropolitan Area” (a new term in 1950), “Metropolitan Districts” (changed from 1940), and “Urbanized Areas” (a new term in in 1950). An Urbanized Area must contain at least one city of 50,000 or more in 1940 or by a special census prior to 1950 and also the surrounding closely settled incorporated and unincorporated places and areas that meet certain criteria (see p. 26). A Standard Metropolitan Area (except for New England) is a county or group of contiguous counties which contains at least one city of 50,000 inhabitants or more. See p. 32. Oklahoma’s two SMAs are the counties only – Oklahoma County and Tulsa County. Metropolitan Districts was a term used in 1940 and, unless I’ve misunderstood, the term is included in the 1950 census only for the purpose of tracing from 1940. See pp. 34-35. Comparative 1940-1950 data for Oklahoma’s 1940 Metropolitan Districts is presented in Part 2 at p. 15.
1950 Part 2 1950 Part 2 consists of 26 pages selected from the 83 page US Summary, including only those which addressed Oklahoma population, and not necessarily every one of them. At the least, I wanted to include Table 30 at p. 25 since it tracks the 1940 Metropolitan Districts into 1950. I considered excluding most other national comparisons/rankings but decided to include most of them since they might come in handy for reasons not presently anticipated. In any event, the following table traces data within the census files and compares the 1940 “Metropolitan Area” with 1950, 1st using the 1940 definition, 2nd using the 1950 “Urbanized Areas”, 3rd using 1950’s “Standard Metropolitan Areas” (in Oklahoma’s case, county population):
1950, Using . . . Metropolitan Area 1940 1940 def. Urban. Area 1950 SMA Oklahoma City 204,424 243,504 243,504 243,504 Non-Okc part 16,805 33,504 31,587 81,848 Okc Total 221,229 277,282 275,091 325,352 Tulsa 142,157 182,740 182,740 182,740 Non-Tulsa part 46,405 65,796 23,571 68,946 Total Tulsa 188,562 248,536 206,311 251,686
1950 Part 3 is 23 pages of Oklahoma-only data. It includes summaries for counties and cities (including numbers dating back to 1890 or whenever the 1st census of a city was taken). The Urbanized Area maps for Oklahoma City & Tulsa are shown, cropped versions appearing below. Among other changes, Oklahoma City’s Urbanized Area now includes Midwest City & Del City. The general breakdown is: Oklahoma City – 275,091 in the city plus 31,587 outside the city, 275,091 total; Tulsa – 182,740 in the city plus 23,571 outside the city, 206,311 total. Unless I missed it, city size in square miles is not shown in part 3.
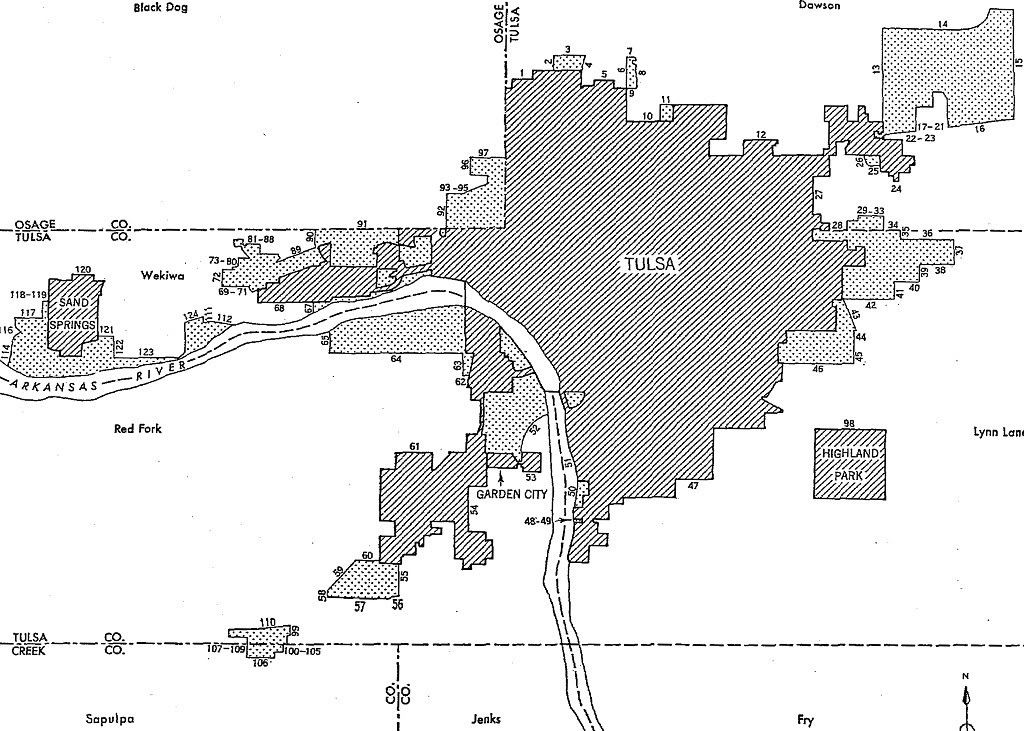
Although somewhat similar to the metropolitan area maps for 1930 and 1940, above, differences are readily noticeable. Boundaries are irregularly shaped, skipping over essentially rural space, and they are no longer more or less rectangular; non-contiguous space is sometimes included (e.g., Del City & Midwest City, Highland Park); and city boundaries are different.
1960 Part 1 contains 33 pages of general census information. It is included for the same reasons mentioned in 1950 Part 1. The term “Standard Metropolitan Area” is no longer used and in its place is “Standard Metropolitan Statistical Area,” defined in this part. The other term used is “Urbanized Area,” introduced in 1950. The older (1940) “Metropolitan Districts” are no longer used. With 1960, Lawton was added to the list of SMSAs and Urbanized Areas.
1960 Part 2 contains 37 of the 66 pages of general US census information which are Oklahoma-oriented. Excluded are most charts and maps since I didn’t see that they really added anything and only ballooned the file size unnecessarily. The map below is an example of something excluded from this file:

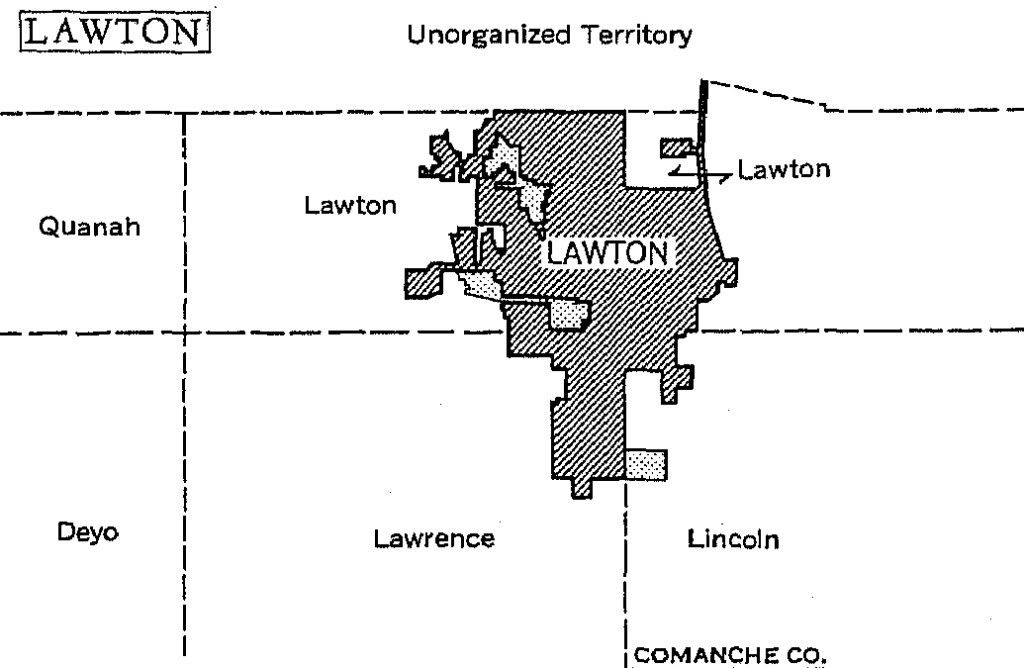
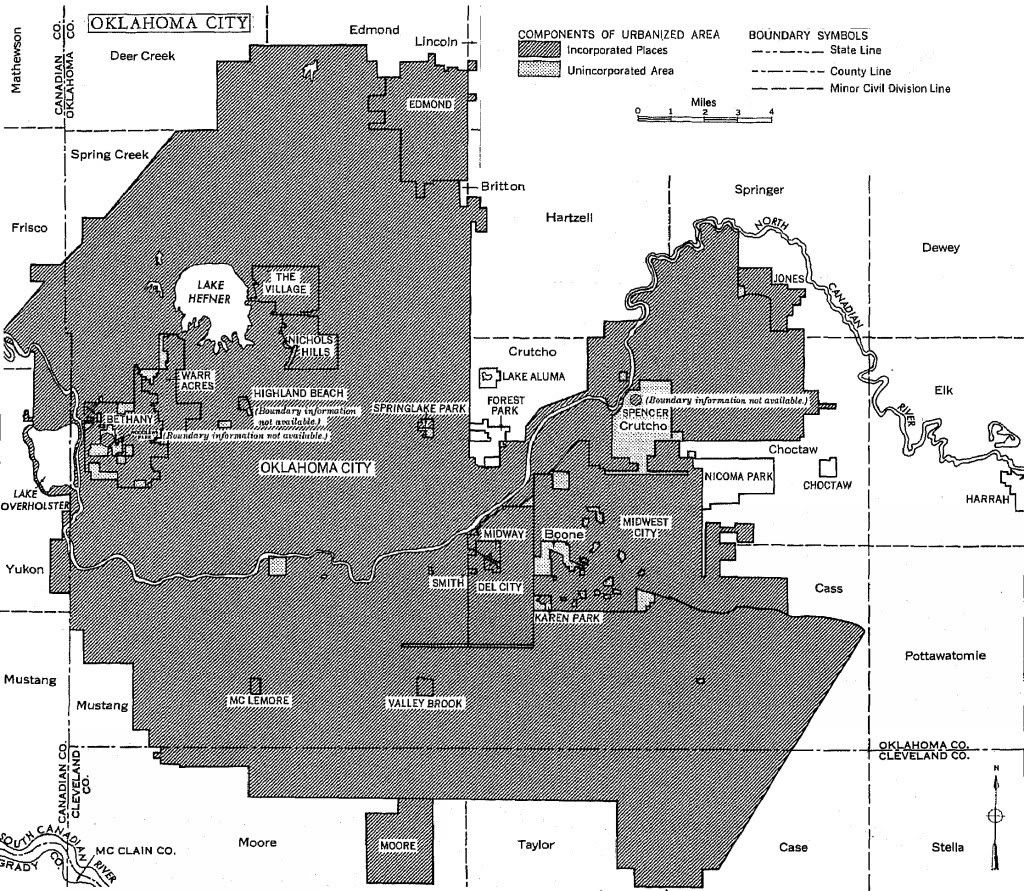
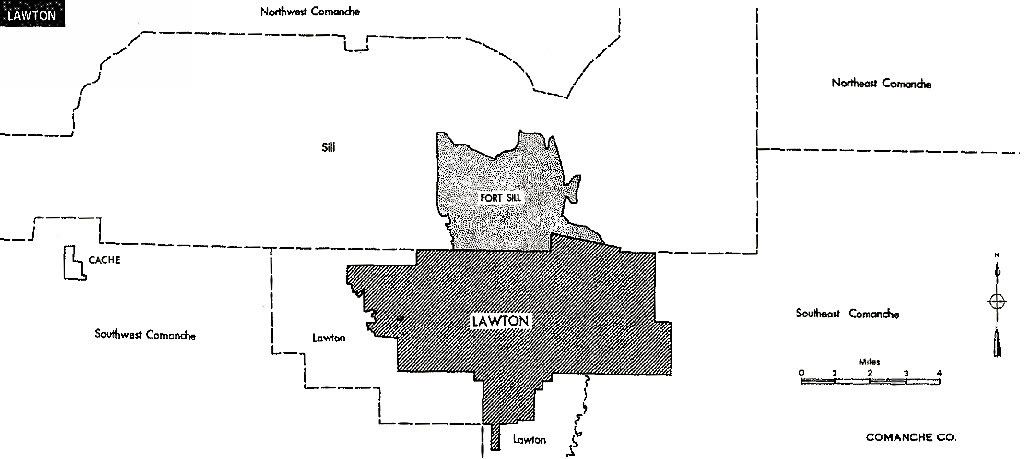
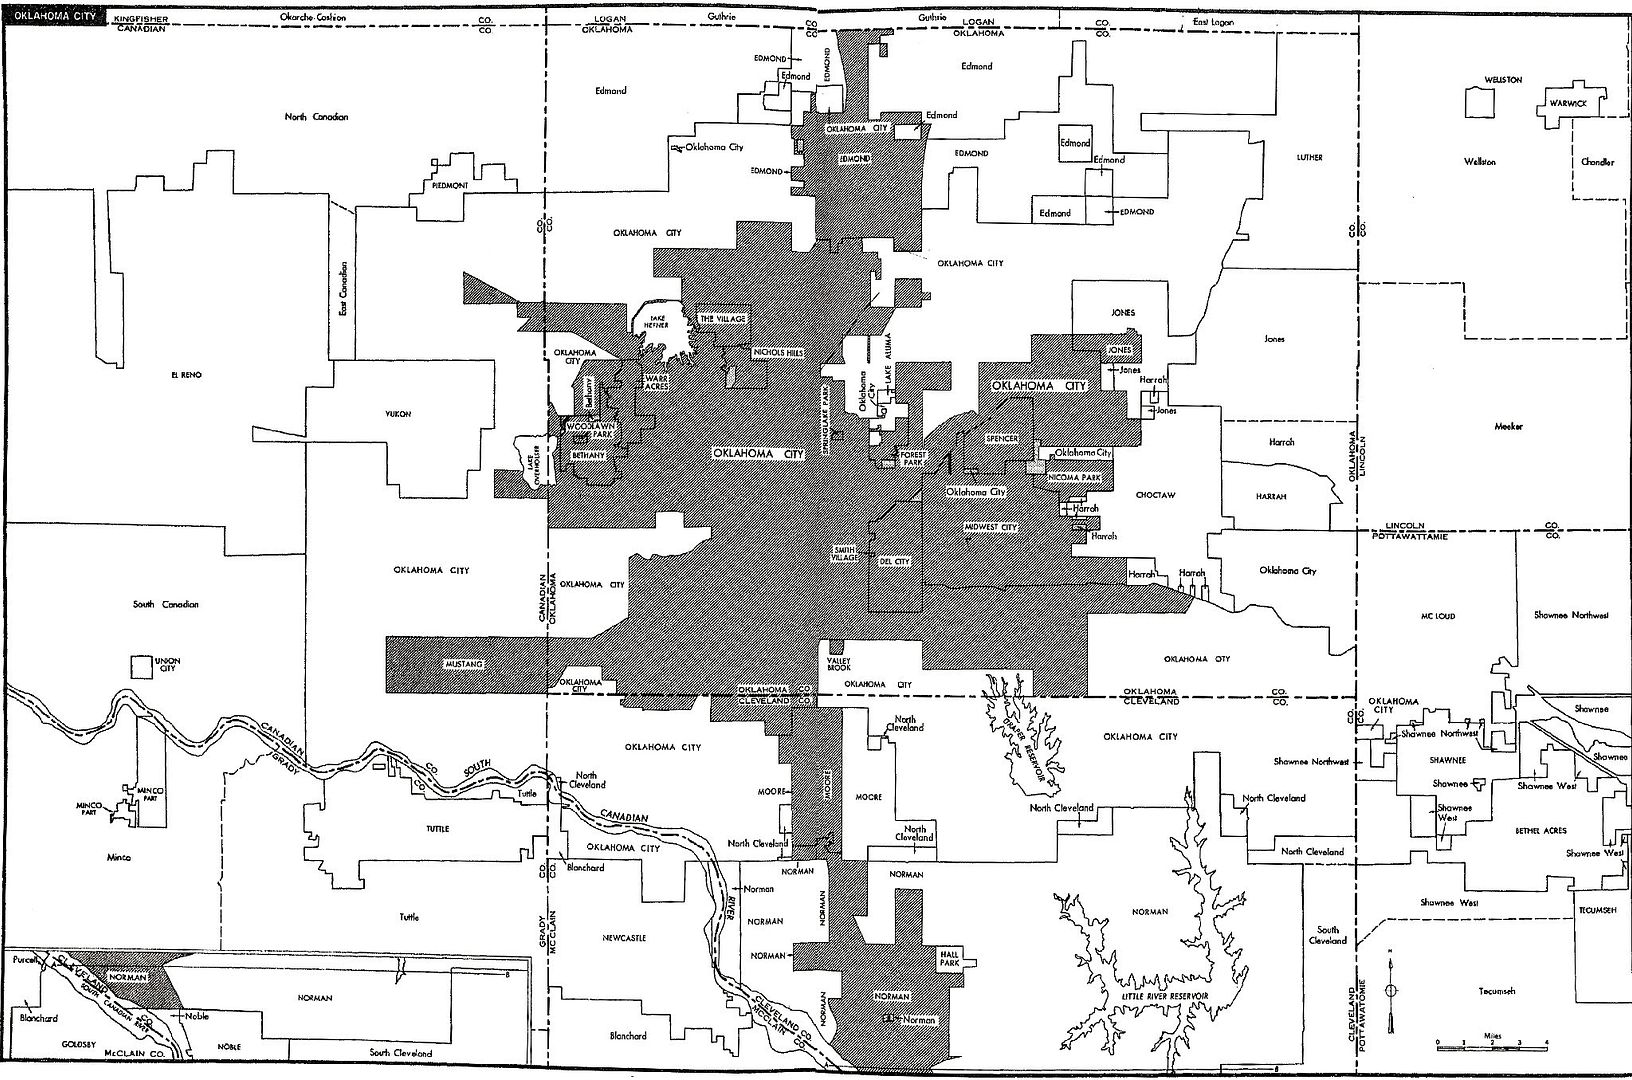
1960 Part 3 contains all 24 pages of Oklahoma number of inhabitants census file. It includes a couple of maps showing Oklahoma’s Standard Metropolitan Statistical Areas and Urbanized Areas, cropped versions of which appear below. Note that the SMSAs are county-defined (Lawton: Comanche; Oklahoma City: Oklahoma, Cleveland, Canadian; Tulsa: Tulsa, Creek, Osage).

Urbanized Areas

The detail included in the above 1960 files, particularly the Part 3 file, reflects the following changes since the 1950 census, using the 1960 definitions (i.e., what the 1960 definitions would have produced in 1950):
Metropolitan Area 1950
SMSA1960
SMSA1950
Urbanized
Area1960
Urbanized
AreaLawton 34,757 61,697 34,757 61,697 Non-Lawton 20,408 29,106 *0 244 Lawton Total 55,165 90,803 *Unclear 61,941 Oklahoma City 243,504 324,253 243,504 324,253 Non-Okc 148,935 187,580 31,587 104,935 Okc Total 392,439 511,833 275,091 429,188 Tulsa 182,740 261,685 182,740 261,685 Non-Tulsa 145,160 157,289 23,571 37,237 Tulsa Total 327,900 418,974 206,311 298,922 * 1950 Lawton non-city Urbanized Area components are not clear. The census tables do not include comparable data for the 1950 census. The tables do show that Comanche County’s 1950 population was 55,165 and that an 1950 “unorganized territory” item is shown as 7,120, which may be Ft. Sill. The 1960 tables reflect an “unorganized territory” item as 16,575, which may likewise be Ft. Sill. But whether or not Ft. Sill’s population is included in the 1950 or 1960 county total is not likely since the 1960 total is Lawton proper plus only 244, obviously not including Ft. Sill.
1970 hasn’t yet been completed as thoroughly as have the others in this collection (i.e., the definitions and national comparison portions from the “national” parts are not yet included). However, I wanted to go ahead and put up what I have so far — the Oklahoma “number of inhabitants” element which has been included for the other census periods. This file contains the same types of data as do 1950 and 1960 Part 3 files and is 35 pages.
The file contains the following Urbanized Area maps for Lawton, Oklahoma City, and Tulsa. Click on the maps for larger views.

I’ve not had time to put together comparisons with the prior decades yet but that will come later.
DO YOU WANT MORE? If your Oklahoma population interests exceed what has been presented here, go to the US Census website and research on your own. A good starting point is to go to www.census.gov and, in the upper right corner, type in what you want to search for, as shown in the truncated graphic below:

Of course, other internet sources exist than the Census Bureau. So, start Googling and happy hunting!